Key Points
- Rapid, Non-Invasive, High-Yield Tool: The STAT ECG is the single best screening test in acute care medicine. It is inexpensive, minimally invasive, and immediately available. Within seconds, it provides direct insight into cardiac rhythm, conduction, and myocardial status. Few other tests can so quickly triage patients, distinguish the sick from the stable, and direct life-saving interventions.
- Comparisons Matter: Always compare a new ECG to prior tracings when available. Baseline ECGs allow rapid recognition of acute ischemia, evolving conduction abnormalities, and new pathology. In high-risk patients, repeating ECGs over time is essential—dynamic changes often provide the earliest evidence of an evolving, life-threatening process.
- Monitoring the Critically Ill: Continuous ECG monitoring is fundamental in unstable or high-risk patients. Real-time surveillance allows for immediate detection of malignant arrhythmias, AV block progression, or ischemic changes—findings that can change management within seconds and alter outcomes.
- Risk Stratification Across Presentations: From chest pain to syncope to undifferentiated dyspnea, the ECG is indispensable in emergency triage. It helps rapidly identify high-risk patients, exclude dangerous mimics, and guide procedural and perioperative decisions. In the crowded acute care environment, no other test offers the same combination of speed, specificity, and practicality.
- Clear, Actionable Documentation: Every ECG interpretation should be documented with precision. This includes not only critical abnormalities but also pertinent negatives (e.g., no ischemic changes, no QT prolongation, no arrhythmia). Clear documentation ensures effective team communication, informs immediate management, and protects against diagnostic error.

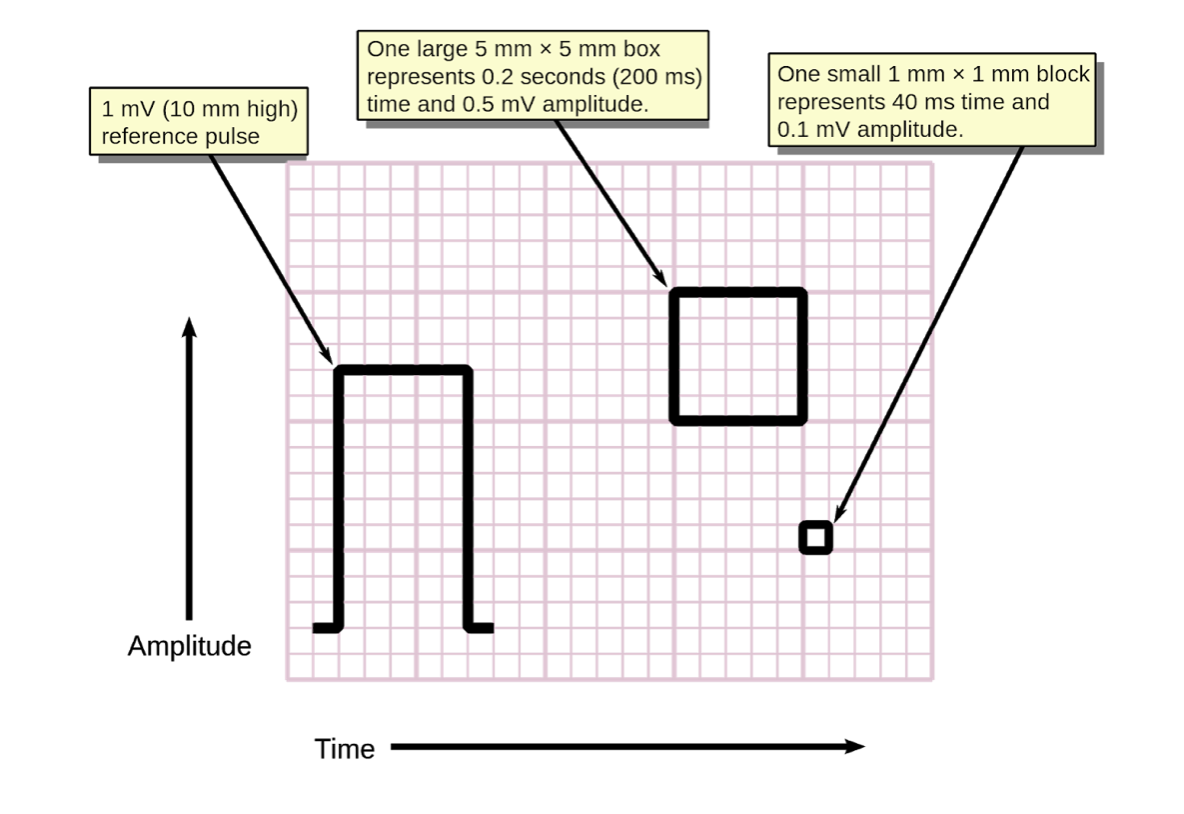
ECGs record cardiac waveforms generated by changes in voltage between different points on the body. These waveforms are displayed on ECG grid paper, which allows for precise measurement of time on the horizontal axis and voltage on the vertical axis.
Core Principles of ECG Interpretation
1. Rate, Rhythm, and Axis – The Foundational Trio
- Rate: Estimate quickly with the 300–150–100–75–60–50 method, or count complexes on a 10-second strip and multiply by 6. For precision, divide 1500 by the number of small boxes between R waves.
- Tachycardia (>150 bpm) in a stable patient would raise concern for SVT or atrial flutter.
- Bradycardia requires correlation with symptoms and assessment for AV nodal disease.
- Rhythm: Determine if a P wave precedes every QRS, if PR intervals are consistent, and if QRS complexes are narrow. These findings suggest normal sinus rhythm.
- Axis: Rapid axis assessment can unmask pathology:
- Right axis deviation → right heart strain (e.g., PE), hyperkalemia, or sodium channel blocker toxicity.
- Left axis deviation → conduction disease, LVH, or ischemia.
2. PR Interval – A Conduction System Window
- Normal: 120–200 ms (3–5 small boxes).
- Prolonged: First-degree AV block, often benign but may indicate conduction disease in acute illness.
- Short: Suggests pre-excitation (WPW) or junctional rhythm—important in young patients with palpitations or syncope.
3. QRS Complex – Duration and Morphology Matter
- Normal: <120 ms (narrow).
- Wide: Can signal bundle branch block, ventricular origin, or pre-excitation.
- Morphology provides critical clues:
- RBBB vs LBBB patterns.
- Strain patterns of LVH or RVH.
- Aberrancy versus true VT in tachycardia.
4. ST Segment and T Wave – Ischemia, Injury, and More
- ST Elevation: Concerning for acute MI when ≥1 mm in two contiguous leads (≥2 mm in V2–V3 for men, ≥1.5 mm for women). Reciprocal changes increase specificity. But remember: ST elevation is a clinical diagnosis, and many mimics exist (pericarditis, early repolarization, LV aneurysm).
- ST Depression: Suggests ischemia. In V1–V4, think posterior infarction.
- T Wave Abnormalities:
- Peaked T waves → hyperkalemia.
- Inverted T waves → ischemia, intracranial pathology, or reperfusion.
5. QT Interval – A Marker of Ventricular Vulnerability
- Normal QTc: <440 ms (men), <460 ms (women).
- Prolonged (>500 ms): Risk for torsades de pointes. Common culprits include medications (antiarrhythmics, antipsychotics), electrolyte disturbances (hypokalemia, hypomagnesemia), and congenital syndromes.
KEY CLINICAL PEARLS:
- Always interpret the ECG in Context: Tracings alone never make the diagnosis. ECG abnormalities must be correlated with the clinical picture. ST elevation in chest pain suggests MI, but in sepsis or renal failure, may represent alternate pathology.
- Use Serial ECGs: Repeat ECGs when the story evolves—ischemia, electrolyte shifts, and arrhythmias are dynamic.
- Document Thoroughly: Note the absence of ischemia, QT prolongation, or arrhythmia to reflect complete clinical consideration and protect against diagnostic error. Recognize normal variants to avoid over-calling pathology.
- ECGs are powerful because they are fast, cheap, and high-yield—but they only save lives when systematically interpreted and integrated with the bedside exam.
Related Content:


