Key Points:
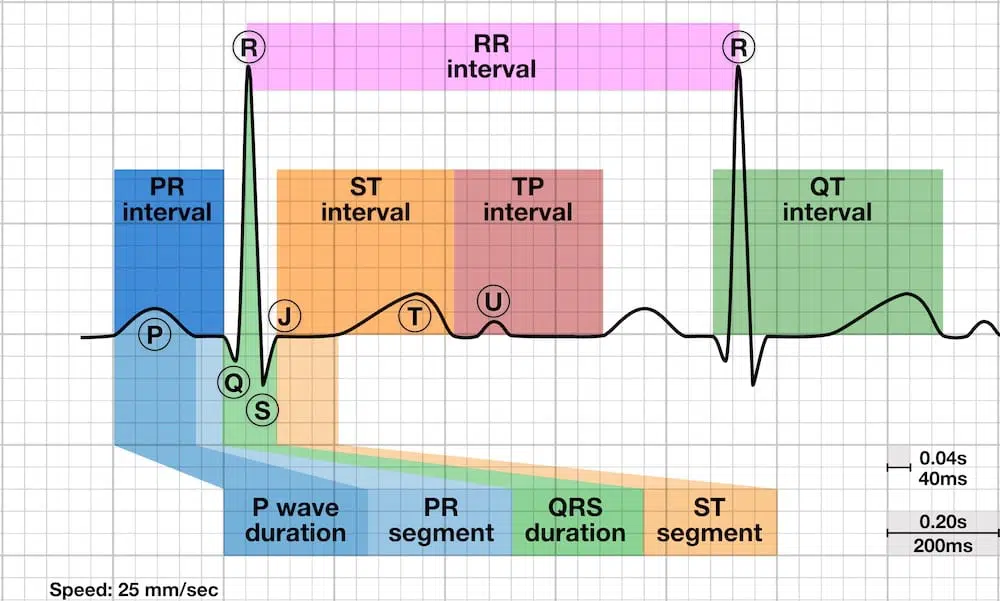
- Every ECG tracing is built from waveforms (deflections), segments (baseline portions between waveforms), and intervals (time that include waveforms plus segments).
- Waveforms describe electrical events (depolarization or repolarization). Intervals tell you how long conduction and recovery take. Segments are where subtle ischemia and injury patterns hide.
- Baseline matters: when judging ST deviation, your default reference is the TP segment (true isoelectric baseline) when it is visible and stable.
- Time-critical bedside interpretation often centers on three things: QRS width and morphology, ST segment and J point, and QT (QTc).
- Small errors in measurement and baseline choice create big clinical errors. Measure deliberately and compare to prior ECGs when possible.

How to Measure Correctly
Standard calibration
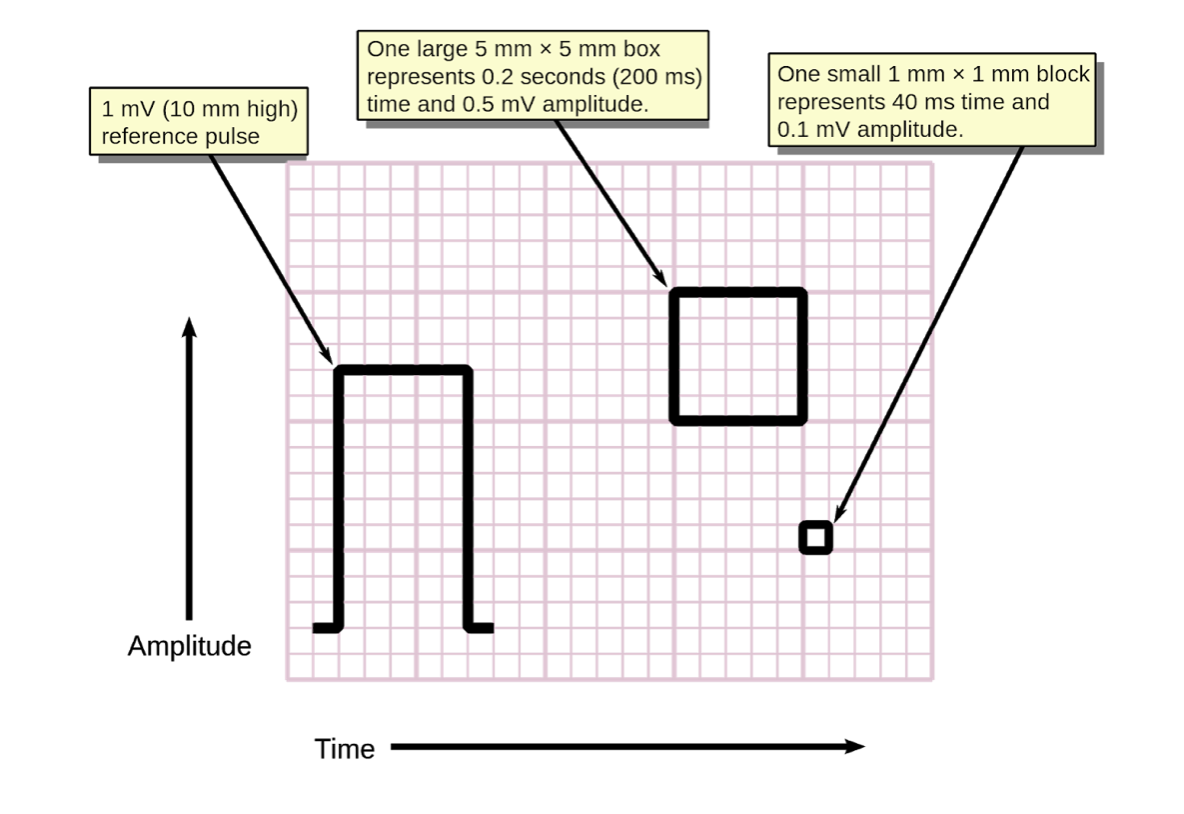
- Paper speed: 25 mm/s
- Voltage: 10 mm/mV
- Rule of thumb at 25 mm/s:
- 1 small box = 0.04 s (40 ms)
- 1 large box = 0.20 s (200 ms)
- 5 large boxes = 1 second
Two practical measurement rules
- Measure intervals in a lead where the onset and offset are clearest, often leads V1/II (P and PR) and V5 or V6 (QRS, QT), but use whichever lead is most clear.
- For QT, measure start of QRS to end of T wave (not the U wave). If there is a prominent U wave, you measure at the end of the T wave, not the end of TU fusion.

Waveforms: the heart’s electrical “signatures”
A waveform is a deflection away from baseline. Waveforms are described by:
- Amplitude (voltage)
- Duration (time)
- Morphology (shape, direction, symmetry, notching)
Key waveforms & what they represent:
- P wave: atrial depolarization
- QRS complex: ventricular depolarization
- Q wave: first negative deflection of the QRS
- R wave: first positive deflection
- S wave: negative deflection after an R wave
- T wave: ventricular repolarization
Dive deeper into the basics of key waveforms here:
- Delta wave: early ventricular activation via an accessory pathway (pre-excitation)
- J point: where QRS ends and ST begins. This is the hinge point for ST elevation or depression measurement.
- J waves (Osborn waves): prominent terminal QRS notch or slur associated with hypothermia and some other conditions.
- Epsilon wave: small terminal deflection in right precordials, associated with arrhythmogenic cardiomyopathies (ARVC/D spectrum).
- U wave: small deflection after T wave. Often seen in bradycardia or with hypokalemia.
Learn more about these waveforms here:
Segments: areas that connect waveforms
A segment is the flat (or near-flat) portion between waveforms. Typically electrically neutral baselines between depolarization and repolarization. Clinically, segments are where you assess deviation from baseline and detect ischemia or pericarditis patterns.
Key segments:
- PR segment: end of P wave to start of QRS during AV nodal conduction. Atrial repolarization (Ta wave) can influence it, and PR depression can occur in pericarditis.
- ST segment: J point to start of T wave. Represents the early phase of ventricular repolarization. ST deviation is one of the most time-sensitive ischemia and occlusion markers on the ECG.
- TP segment: end of T wave to start of next P wave. This is the true electrical baseline when it is visible and stable, and it is your best reference for ST deviation when available.
Dive deeper into the key segments here:
Intervals: timing across the cardiac cycle
An interval includes one or more waveforms and segments. Intervals are where you diagnose conduction delay and repolarization risk.
Key intervals:
- PR interval: start of P to start of QRS.
- Normal: 120–200 ms
- Prolonged: AV conduction delay (can be benign or pathologic depending on context and QRS width)
- Short PR: consider pre-excitation (if delta wave present) or enhanced AV nodal conduction patterns
- QT interval (and QTc): start of QRS to end of T wave. This is depolarization plus repolarization time for the ventricles.
- Prolonged QTc: risk of torsades, especially with triggers (bradycardia, hypokalemia, hypomagnesemia, QT-prolonging drugs)
- Short QT: consider hypercalcemia or rare congenital short QT syndrome
Dive deeper into the key intervals here:
- QRS duration (technically a duration, often treated as a key interval): narrow vs wide changes your entire differential and treatment pathway.
- RR interval: rhythm regularity and rate calculation.
- JT interval: can help when QRS is wide and QT becomes harder to interpret.
Learn more about these topics here:
Key Clinical Pearls:
- ST segment and J point changes are time-sensitive. Train your eye to see subtle ST elevation less than 1 mm when it is territorial and paired with reciprocal changes.
- PR interval interpretation is incomplete without the QRS. A long PR with a narrow QRS is usually AV nodal delay. A long PR with a wide QRS raises concern for infranodal disease.
- QTc is not optional in syncope, seizure-like presentations, bradycardia, overdose, and electrolyte derangements, or “mysterious polymorphic VT.” It is a risk marker, not a diagnosis.
- Use TP as baseline for ST deviation when possible, especially when PR segment is drifting, depressed, or influenced by atrial repolarization.
Related content & recommendations:


